| Home |
 Screenshots Screenshots | |
|
The
Gekko graphical user interface (GUI) is developed in a modern
programming environment (.NET), and ease of use of the GUI is a key
priority. This concerns both the GUI and the Gekko command language.
The goal is to provide a smooth and productive user experience, so that
the user can concentrate on the real issues (the models, data,
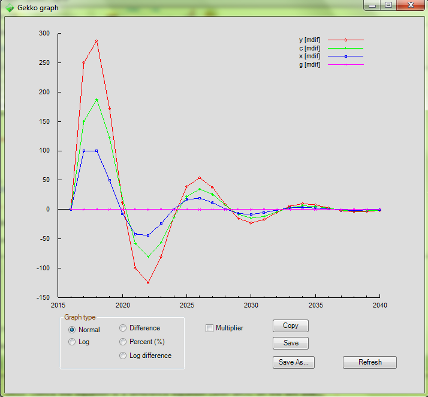
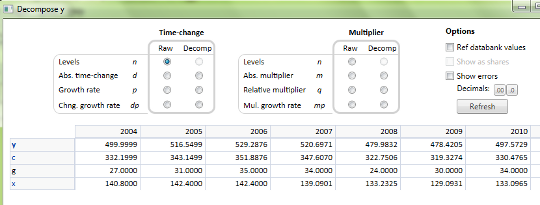
scenarios, etc.). Gekko graphical user interface (main screen) Graph example  Graphs in Gekko are made via gnuplot (embedded in the Gekko installation). Decomposition example  Decomposition can decompose equations, either regarding changes from period to period, or changes from a baseline databank to an alternative databank. Such decomposition is very convenient when trying to explain how the effects in a given model propagate from equation to equation. There are more screenshots available in the guided tour section.
| |